
Flow chart in IELTS writing
Flow chart is a diagrammatic representation that explains the workflow of a process. It is a picture of the separate steps of a process in sequential order. It is a generic tool that can be adapted for a wide variety of purposes, and can be used to describe various processes, such as a manufacturing process, an administrative or service process, or a project plan.
IELTS Flow Chart
A flow chart
shows a process, sequence of events, or stages from start
to finish — often describing how something is produced, developed, or occurs
naturally.
Your goal: describe the process clearly, logically, and accurately using
correct grammar and vocabulary.
Structure (4-Paragraph Format)
1Introduction
- Paraphrase
the question statement.
- Example:
- Question: The
diagram shows how electricity is generated from geothermal energy.
- Paraphrase:
The flow chart illustrates the process of producing electricity using
geothermal power.
2
Overview
- Summarize
the main stages or overall process.
- Avoid
details here.
- Example:
- Overall,
the process consists of five main stages, beginning with the cold water
being pumped underground and ending with the production of electricity.
3
& 4 Body
Paragraphs
- Describe
each stage in logical order (use connectors).
- Include specific
details like arrows, directions, and transitions.
- Avoid
repetition or unnecessary interpretation.
Useful Vocabulary for Flow Charts
Process Words
- begins with
/ starts with
- followed by
/ then / next / after that
- subsequently
/ afterwards
- finally /
eventually / in the last stage
Verbs for Actions
- is pumped /
is heated / is filtered / is processed
- passes
through / flows into / enters / travels to
- transforms
into / results in / produces
Nouns and Phrases
- stage / step
/ process / cycle / system / mechanism
- the input /
output / final product / end result
You should spend about 20 minutes on this task.
Write at least 150 words

The given flow chart illustrates
different steps that a high school graduate has to go through to be admitted to
a university.
Overall, the process
begins with the application submission and ends with the completion of the
university entry.
According to the illustration, to be able to
apply for the university admission, someone has to complete the high school
diploma. The initial step involves getting the application form online and then
submitting it to the admin. The admin categories applications in two main
groups – rejected and accepted. Those who have been rejected are either
permanently refused or given an opportunity to reapply for a different subject.
To apply for an
alternative course, a contestant has to go through the whole process again. The
accepted pupils are also classified in two categories – directly accepted and
provisionally accepted. Those who are provisionally accepted need to submit
further documents and this process usually takes two weeks. On the contrary,
who are fully accepted for the admission, select their preferred subjects and
register with the dean of the faculty. After the completion of these steps, a
student is considered eligible to enter the university and these final steps
also require 2 weeks.
(198 words)
Sample 2
You should spend about 20 minutes on this task.
The flowchart below shows the process involved in completing the
work experience requirement for university students.
Summarise the information by selecting and reporting the main
features, and make comparisons where relevant.
» You should write at least 150 words.
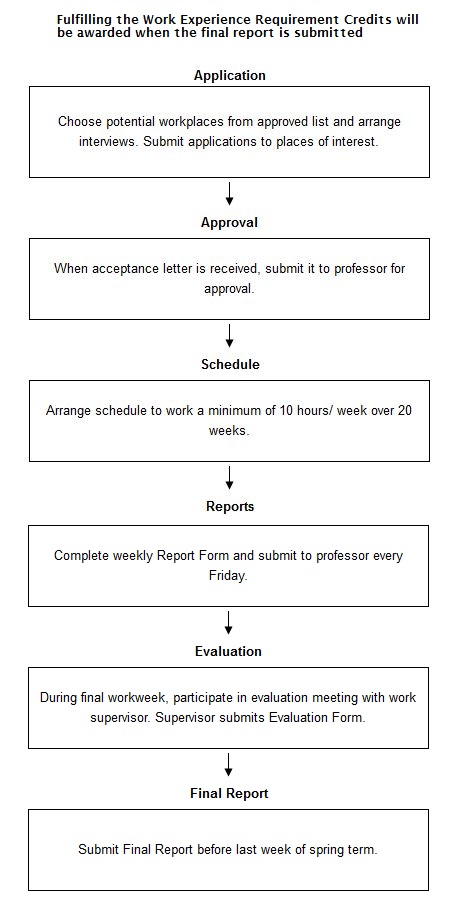
As can be seen in the step-by-step
diagram, there are six steps involved in fulfilling the requirements beginning
from the Application submission till submitting the final report.
To start with the first step in the
diagram, the process starts with ‘Application’ that requires a student to
choose a suitable and potential workspace and to arrange the interview to
submit the application in the fields of interest. The next step in the chart is
the approval stage where a candidate needs to be accepted and then needs to
submit the acceptance letter to a professor for approval. After this part, the
student is required to make a schedule to work for more than 10 hours per week
for more than 20 weeks.
Moving ahead to the fourth stage, the candidate has to fulfil the weekly work report and present to the corresponding professor each Friday. In the Evaluation step, the applicant will participate in the evaluation meeting in the final week of his/ her work with the work supervisor and the supervisor would submit the evaluation form. The final place known as ‘Final Report’, asks the candidates to submit the final report before the last week of spring semester.
(219
words)
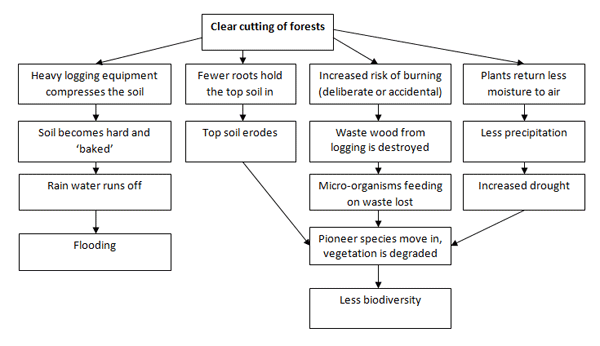
The given illustration gives essential information regarding the impact of deforestation. At a glance, deforestation brings an array of negative consequences, including floods, reduced biodiversity, drought and soil erosion.
As per the presentation in the illustration, the primary consequence and result of deforestation could be divided into four significant categories. First of all, heavy logging tools and equipments compress the soil, making it harder and baked. Owing to this, rainwater runs off, and the devastating floods hit.
Secondly, only a few roots manage to hold the topsoil in place, courtesy of cutting trees from the forest, which ultimately leads to soil erosion.
Third, the risk of accidental or deliberate burning uprises and waste woods from the logging is demolished. Micro-organisms depend upon the waste lost, and pioneer species move in while the vegetation gets reduced. The entire process turns out to be a massive loss to the biodiversity.
Finally, deforestation leads to lesser moisture returning to the air by plants, causing lesser precipitation. In turn, it gives rise to drought—all of this cause less biodiversity.
Sample 4
You should spend 20 minutes on this task.
The chart below shows the steps in the manufacturing of electronic products at Sparks Inc. Describe the main features and make comparisons where relevant.
You should write at least 150 words.

The provided flowchart illustrates the process of consumer goods production in an orderly manner and includes various stages of production and sales together with the feedback supplied towards the earlier stages which allows improvements and modifications throughout the process.
Overall, this flowchart illustrates the production process and the feedback provided at various stages of goods manufacturing.
The product manufacturing process is initiated with the purchase of raw materials and manufactured components which are kept in storage until the production process is planned. Production planning stage involves product research and design. The process is carried through the stages of assembly, inspection, testing and packaging of the final product sequentially which is then dispatched for sales to the consumers.
Production planning provides feedback for storage. Likewise, sales provide feedback for both production planning and market research, which in turn provides feedback for advertising and packaging. Similarly, both market research and testing provide feedback for design.
Sample 5
You should spend about 20 minutes on this task.
The flow chart illustrates the consequences of deforestation.
Summarize the information by selecting and reporting the main features, and make comparisons where relevant.
You should write at least 150 words.
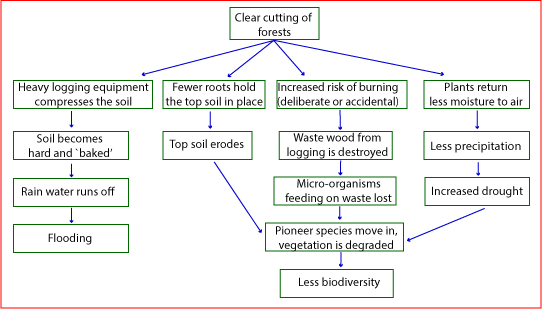
The provided flow chart gives an
information about the effects of deforestation.
Overall, the deforestation brings many
negative consequences including flooding, decreased biodiversity, drought and
soil erosion are some of them.
As
is presented in the illustration, the main consequences and outcomes of
deforestation could be divided in four major categories. First, heavy logging
tools and equipment compress the soil which in terms makes the soil hard and
baked. Because of that rain water runs off and the devastating floods hit us.
Secondly, because of the cutting trees from the forest only few roots hold the
top soil in place and this causes the soil erosion. Thirdly, the risk of
deliberate or accidental burning increases and waste woods from the logging is
destroyed.
Microorganisms rely on the waste lost and
pioneer species move in while the vegetation is reduced. This whole process
creates a great loss to the biodiversity. Finally, because of the deforestation
less moisture returns to air and that causes less precipitation. In turns it
causes drought. The increased drought, soil erosion, and because of vegetation
degradation less biodiversity could be observed.
(184 words)
Sample 6
The flow chart below
explains how laundry is handled. Using information from the flow chart describe
the laundry process.
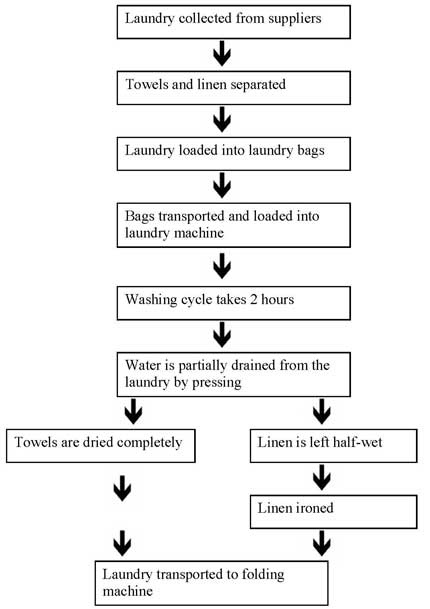
The provided flow chart delineates the process of handling laundry.
Overall, the whole process is composed of a number of different steps.
According to the chart, the collection of laundry is done from suppliers and this is the first step. In the second phase, towels and linen are separated. The third step is to load the laundry into laundry bags. After this stage, these bags are transported and loaded into laundry machines. Then, the washing takes place, and this washing cycle is for two hours. It is the fifth stage.
The next step is divided into two parts: First where towels are dried completely, and another one is where Linen is left half-wet. This step belongs to the concept where water is partially drained from the laundry by pressing. The half-wet linen is then ironed and forwarded to the folding machine. The dried towels are sent to this machine directly without the need for iron. (155 words)

No comments:
Post a Comment